Databricks Lakehouse Architecture for Operational Data Replication
Change data capture fills the replication gap that makes or breaks lakehouse trust.
The Databricks Lakehouse promises one platform for both transactional and analytical work, but that promise depends entirely on the pipeline that feeds it, and that pipeline is where most teams still get hurt. OLTP systems are built for fast, narrow writes: a customer places an order, a balance updates, a row changes. OLAP systems are built for the opposite kind of work, scanning millions of rows to answer a question a person or a model actually cares about.
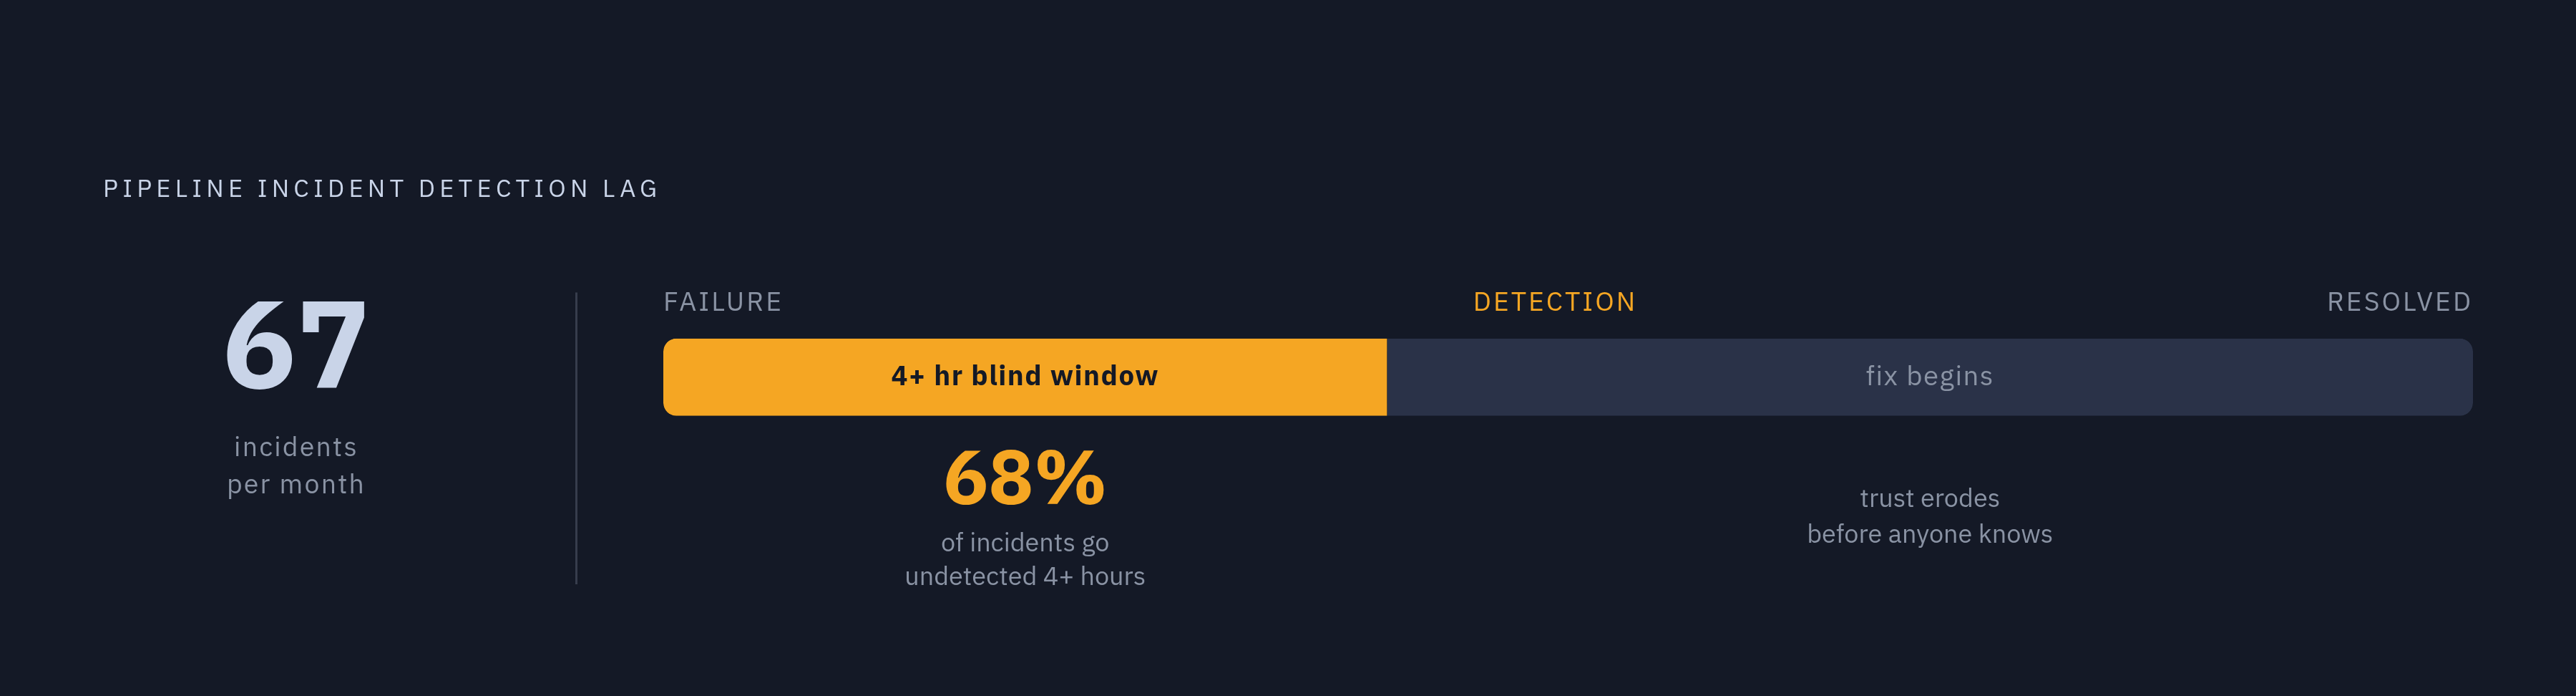
That cost appears in the numbers. Data teams report an average of 67 pipeline incidents a month, and in 68% of cases, it takes four hours or more just to figure out that something broke, before anyone can even start fixing it Polestar Analytics. Four hours to detect, not resolve Polestar Analytics. That gap between "the pipeline failed" and "someone found out" is where trust in a data platform erodes fastest.
A lakehouse doesn't fix this by existing. A unified architecture with stale or partial operational data is still a fragmented system, just wearing a nicer label. So the real design question for any team building on Databricks isn't whether to unify OLTP and OLAP, it's whether the replication layer feeding that lakehouse can capture every database change continuously, in order, and without silently dropping fidelity along the way. Everything downstream, from bronze tables to gold dashboards to whatever model gets trained on top, depends on getting that one layer right. What "bridging" actually looked like was change data capture jobs, ETL syncs, and replication logic that broke on a schedule and introduced latency measured in minutes to hours.
CDC and the rise of log-based capture as the standard approach
Change data capture is a data integration method that identifies row-level changes (inserts, updates, deletes) as they happen and moves only those changed rows downstream, instead of reloading a whole table every time something shifts. That distinction matters more than it sounds like it should. Batch ETL works by re-scanning or reloading large chunks of data on a schedule: simple to reason about, but wasteful, and slow to reflect what actually happened in the source system. CDC skips that waste. It sends only the delta, which cuts compute cost, removes the need for maintenance windows, and keeps downstream tables aligned with the source close to real time.
There are four ways to actually capture those changes: reading the transaction log, using database triggers, comparing timestamps, or relying on a native change feed built into the source system. Of these, log-based capture is what production systems actually run on. It reads directly off the database's own transaction log, so it adds no load to the primary workload, and it captures every change in the order it happened rather than just the final state a query would return. Debezium is the reference implementation here: it reads the log, publishes events onto Kafka topics, and Kafka Connect handles the source-side integration for databases like MySQL, PostgreSQL, and SQL Server.
The sequencing column comes back later when the AUTO CDC API within Lakeflow Pipelines enters the picture.
CDC is the extraction mechanism. SCD is the modeling decision on the other end. Keep that distinction in mind, because Databricks' native tooling treats them as two separate concerns solved by the same API.
Not every team can or will turn CDC on at the source, whether for cost reasons, performance concerns on a production database, or because a legacy system simply doesn't support it. The fallback is snapshot-based capture: periodic full snapshots of a table, compared to derive what changed. It works, but it gives up change-level granularity and costs more compute per run, since the system has to diff full snapshots rather than read a stream of discrete events. Each CDC event contains several key components.
How Databricks handles CDC natively through Lakeflow Pipelines and the AUTO CDC API
Building CDC handling by hand with SQL MERGE statements sounds straightforward until you actually try it. Event ordering, deduplication, partial updates, schema evolution: each one needs its own custom logic, solved independently, and the result is a maintenance burden that grows every time the source schema shifts. Databricks built the AUTO CDC API inside Lakeflow Pipelines specifically to take that burden off engineering teams (Delta Live Tables was renamed and incorporated into Lakeflow pipelines, also known as Lakeflow Declarative Pipelines).
Both let a team describe the shape of the incoming change feed and the target table, and the pipeline handles ordering, deduplication, out-of-order arrivals, and schema evolution on its own. It supports both SCD Type 1, which just overwrites to the current state, and SCD Type 2, which preserves history using __START_AT and __END_AT columns to mark when each version of a row was valid.
The ordering constraint only shows up once, usually in production. AUTO CDC processes events according to the sequencing column, and that column has to be monotonically increasing. NULL sequencing values aren't supported at all. If a source system doesn't emit a clean, ever-increasing sequence number, that's a problem to solve before the pipeline runs, not after it fails.
For teams that cannot enable CDC on the source, there's APPLY CHANGES FROM SNAPSHOT, which processes full table snapshots and derives SCD Type 1 or Type 2 changes, trading granularity for compatibility with constrained source environments.
This isn't theoretical. Navy Federal Credit Union runs AutoCDC inside Lakeflow Spark Declarative Pipelines to process large-scale, real-time event streams, handling roughly 9 billion application events continuously, while cutting out the custom CDC code and the ongoing maintenance that used to come with it ClickHouse - Wikipedia. Databricks provides AUTO CDC INTO (SQL) and create_auto_cdc_flow() (Python). There are valid sources for AUTO CDC.
How CDC events flow through the medallion architecture from bronze to gold
Once CDC events are captured, they move through the same bronze, silver, gold structure that defines the medallion architecture, but CDC changes what each layer is actually responsible for. Bronze is where raw change events land, untouched: operation codes, sequencing metadata, every field of the row, preserved exactly as captured. Silver is where the cleanup happens, validation, deduplication, and this is the layer where SCD logic actually runs to decide how a change gets modeled. Gold holds the dimensional models and aggregations that reporting and analytics actually query, and because only the changed records need to move through, keeping gold current costs roughly what the change volume costs, not what the full dataset costs.
That's the efficiency argument in one sentence: cost scales with what changed, not with what exists. It's the same principle that makes CDC preferable to full-table batch reloads in the first place, just applied one more time as data moves layer to layer.
Delta Lake's own Change Data Feed does something similar internally. Changes propagate changes. It's a quieter mechanism than the initial CDC ingest, but it's doing the same job: moving only what moved.
There's a governance dimension here that's easy to underweight until an audit forces the issue. Because CDC preserves the full record of how data changed at each layer, medallion architecture built on top of it gives regulated industries, finance, healthcare, a clear trail of how a number in a gold table got there. That's a requirement in those industries, not a nice-to-have. It's a requirement.
None of it works, though, if the bronze layer doesn't receive changes with full fidelity, operation type, sequence number, every field on the row. A replication tool that strips metadata, or batches events before delivering them, breaks the SCD logic sitting in silver, and the damage doesn't announce itself immediately. It appears later, as a gold table that quietly stopped matching reality.
Database-specific replication mechanics teams need to understand before connecting to Databricks
Every source database speaks its own replication language, and the mechanics differ enough that treating them interchangeably is a mistake. PostgreSQL uses logical replication, a publish-and-subscribe model that's distinct from the block-level physical replication Postgres also supports, and the two run side by side without conflict. The standard output plugin for this is pgoutput.
Lakeflow Connect's PostgreSQL connector, currently in Public Preview, builds on exactly this mechanism: logical replication through pgoutput, requiring Postgres 13 or later on the primary instance itself (a read replica won't do), connecting over TLS through a JDBC connection, with credentials held in a Unity Catalog connection. It pulls a snapshot plus ongoing change data through an ingestion gateway and lands it in Delta tables. Lakebase, Databricks' own managed Postgres, doesn't expose superuser access or tablespaces, and it doesn't offer native logical replication out of the box. That gap is exactly what Lakebase's own Change Data Feed was built to close, covered in the next section.
MongoDB takes a different approach entirely, with a native change streams API that captures inserts, updates, and deletes from collections as they happen. Debezium, along with various managed platforms, builds CDC support for MongoDB directly on top of this API.
DynamoDB works differently again. DynamoDB Streams is AWS's own mechanism for capturing item-level changes, inserts, updates, deletes, off of a DynamoDB table. Retention is a 24-hour window.
Each of these systems has its own protocol, its own constraints, its own metadata shape. A replication layer that absorbs those differences, handling schema drift, reordering, and failure recovery per source type, saves a data team from having to become an expert in four separate replication protocols at once, especially given that data teams report an average of 67 pipeline incidents per month and 68% of teams require four or more hours just to detect a failure when one occurs Polestar Analytics. That's not a minor convenience. A platform team that doesn't have to babysit replication protocols spends its time on modeling instead of debugging someone else's log format.
Lakebase and its native Change Data Feed: what changes when the operational database lives inside Databricks
Lakebase is Databricks' fully managed, serverless Postgres database, built directly into the Data Intelligence Platform, and it reached general availability with an announcement on February 3, 2026. Branching, scale-to-zero, and the separation of storage from compute, all of it traces back to Neon's architecture datalumberjack.medium.com.
The specs are these: Storage sits on cloud object storage with 99.999999999% durability by default, which is superior to traditional replica-based redundancy Databricks. A single instance supports up to 8TB of storage Prolifics. Compute scales up instantly when demand hits and scales all the way to zero when it's idle, so cost tracks actual usage, a design that suits bursty workloads, development environments, and AI agents that spin up a temporary database and tear it down minutes later. It also supports pgvector and other Postgres extensions relevant to AI workloads.
Every existing Provisioned instance was automatically upgraded to Autoscaling, with that migration completing in July 2026, and the two variants differ in Postgres version, RAM allocation per unit, restore window, and hostname.
Lakebase's Change Data Feed, which entered Public Preview on May 27, 2026, matters most for this piece. Turning it on once per Lakebase project applies it to every table in that project, no per-table configuration required. It exposes every table's changes through Unity Catalog Managed Tables. Any engine, model, or agent with the right access can read those changes directly, no database connector required, no replication state to monitor, no separate extraction job to babysit. Streaming pipelines, DBSQL materialized views, Agent Bricks embeddings, all of them subscribe to the same isolated feed without adding load to the primary operational workload.
That's a real architectural shift. If the operational database is Lakebase, it becomes the native bronze layer directly, and Lakebase's Synced Tables handle the return trip, serving gold-layer data back out to applications. Data moves both ways: Synced Tables replicate lakehouse data into Lakebase so applications get low-latency reads, and Lakehouse Sync uses CDC to continuously push Lakebase's Postgres tables into Unity Catalog managed Delta tables for analytics and downstream ML work. For a team running Lakebase, the separate extraction pipeline that used to be required just to reach bronze disappears. The CDF is the pipeline, governed end to end through Unity Catalog, with full lineage attached.
That only holds, though, if Lakebase is where the operational data actually lives. Teams with operational data in external Postgres, MySQL, MongoDB, or DynamoDB still need a replication layer connecting those sources to Databricks, because Lakebase CDF only helps when Lakebase is the source. It solves a real problem, but only for the slice of the market whose operational database has already moved onto the platform. There is a two-way data movement pattern.
The CDC tool landscape: how self-hosted, cloud-native, and managed options compare for Databricks replication
Self-hosted open source tooling, with Debezium as the standard example, reads logs directly and is powerful and widely adopted, but it hands the team responsibility for standing up and running Kafka clusters, writing consumer code, and handling schema evolution and failure recovery by hand. It's the reference implementation for log-based CDC, but the build-and-operate cost is real and it doesn't go away after launch.
Cloud-native tools sit a step up in abstraction. AWS DMS, for instance, plugs naturally into AWS-hosted sources and targets and supports Databricks as a destination, though exactly how much operational burden it removes depends on how it's deployed. Fully managed SaaS platforms go further still, abstracting the infrastructure entirely, though they differ from each other in latency, how many source connectors they cover, pricing structure, and how much schema evolution they handle without manual intervention.
Picking between these options comes down to a handful of concrete questions, not vibes. How fast does a change actually reach Databricks, sub-second for log-based tools that stream continuously, versus batch-interval delays for tools that buffer before sending anything. Does the tool guarantee each change lands exactly once, or does that deduplication work fall on the team consuming the feed. Does an ALTER TABLE on the source get picked up and applied automatically, or does it break the pipeline outright. How deep is the connector support for Postgres, MySQL, MongoDB, DynamoDB, and whatever else sits in the stack, since breadth of source coverage without depth on each source doesn't actually solve anything. And who's on call when something breaks: a self-hosted setup puts that on the data team, a managed service absorbs it as part of what's being paid for.
Managed alternatives trade operational load for a licensing cost, a tradeoff that should be weighed against the cost of self-hosting a pipeline.
What makes this decision genuinely open, rather than a foregone conclusion, is that Databricks' own processing layer doesn't care which extraction tool feeds it. AUTO CDC accepts events from Debezium, Oracle GoldenGate, AWS DMS, or, in Databricks' own phrasing, "another replication service". The platform sets requirements on the shape of the data arriving at bronze: full row fidelity, an operation code, a clean monotonic sequence number. It leaves how that data got extracted in the first place undictated. That's the right design choice, because it means tool selection stays a genuine build-versus-buy decision, weighed against a team's own scale, in-house Kafka expertise, and appetite for owning infrastructure, rather than a constraint the platform forces on anyone. Streamkap resources describe four architectural categories. There are criteria that actually differentiate tools for Databricks replication workloads. Polestar Analytics reports that teams that have assembled Debezium + Kafka pipelines find that the infrastructure cost (not just in initial build time but in ongoing incident response, recall: 67 pipeline incidents per month on average) is frequently underestimated, and managed alternatives trade licensing cost for that operational surface area. SOURCE PAGES are what the pages behind the outline's links say.