Consumer Lag Alerting for Kafka-Based CDC Pipelines
Three monitoring layers catch different CDC pipeline failures before data falls too far behind.
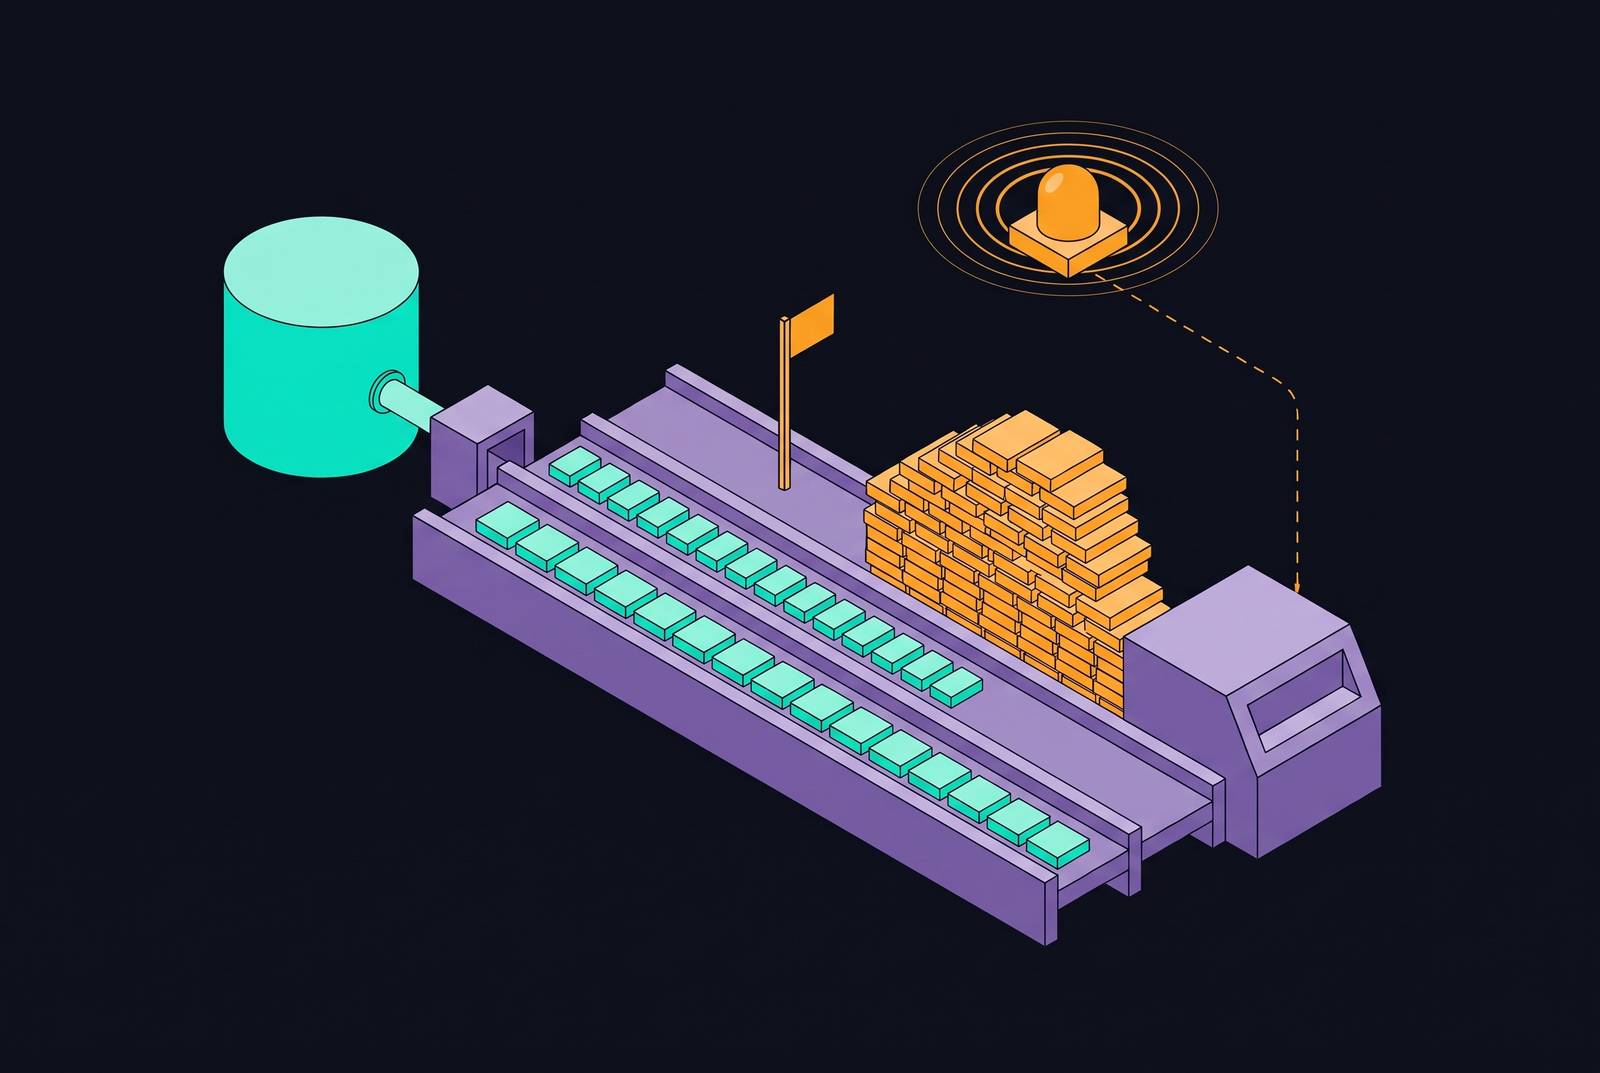
Consumer lag alerting for Kafka-based CDC pipelines requires three layers of evidence, combining committed-offset lag, client-side JMX metrics, and upstream replication health. Each detects failures the others miss, so a healthy Kafka lag dashboard alone cannot establish that the destination reflects the source. The alerting objective is data freshness.
Why consumer lag means something different inside a CDC pipeline
In a general Kafka pipeline, lag is a throughput concern. In a CDC pipeline, it is a data correctness problem because committed source changes have not yet reached the destination. The systems disagree on their current state. A fraud-detection consumer processing yesterday’s backlog makes decisions on stale signals, while an AI agent reading a feature store built on a lagging pipeline reasons on outdated facts.
That distinction changes what an alert must establish. Detecting a slow consumer is useful, but the operational question is how far the destination has drifted from source truth and whether that drift is growing. Message counts describe a backlog without necessarily describing its consequences.
The three signal layers that together cover the full failure surface
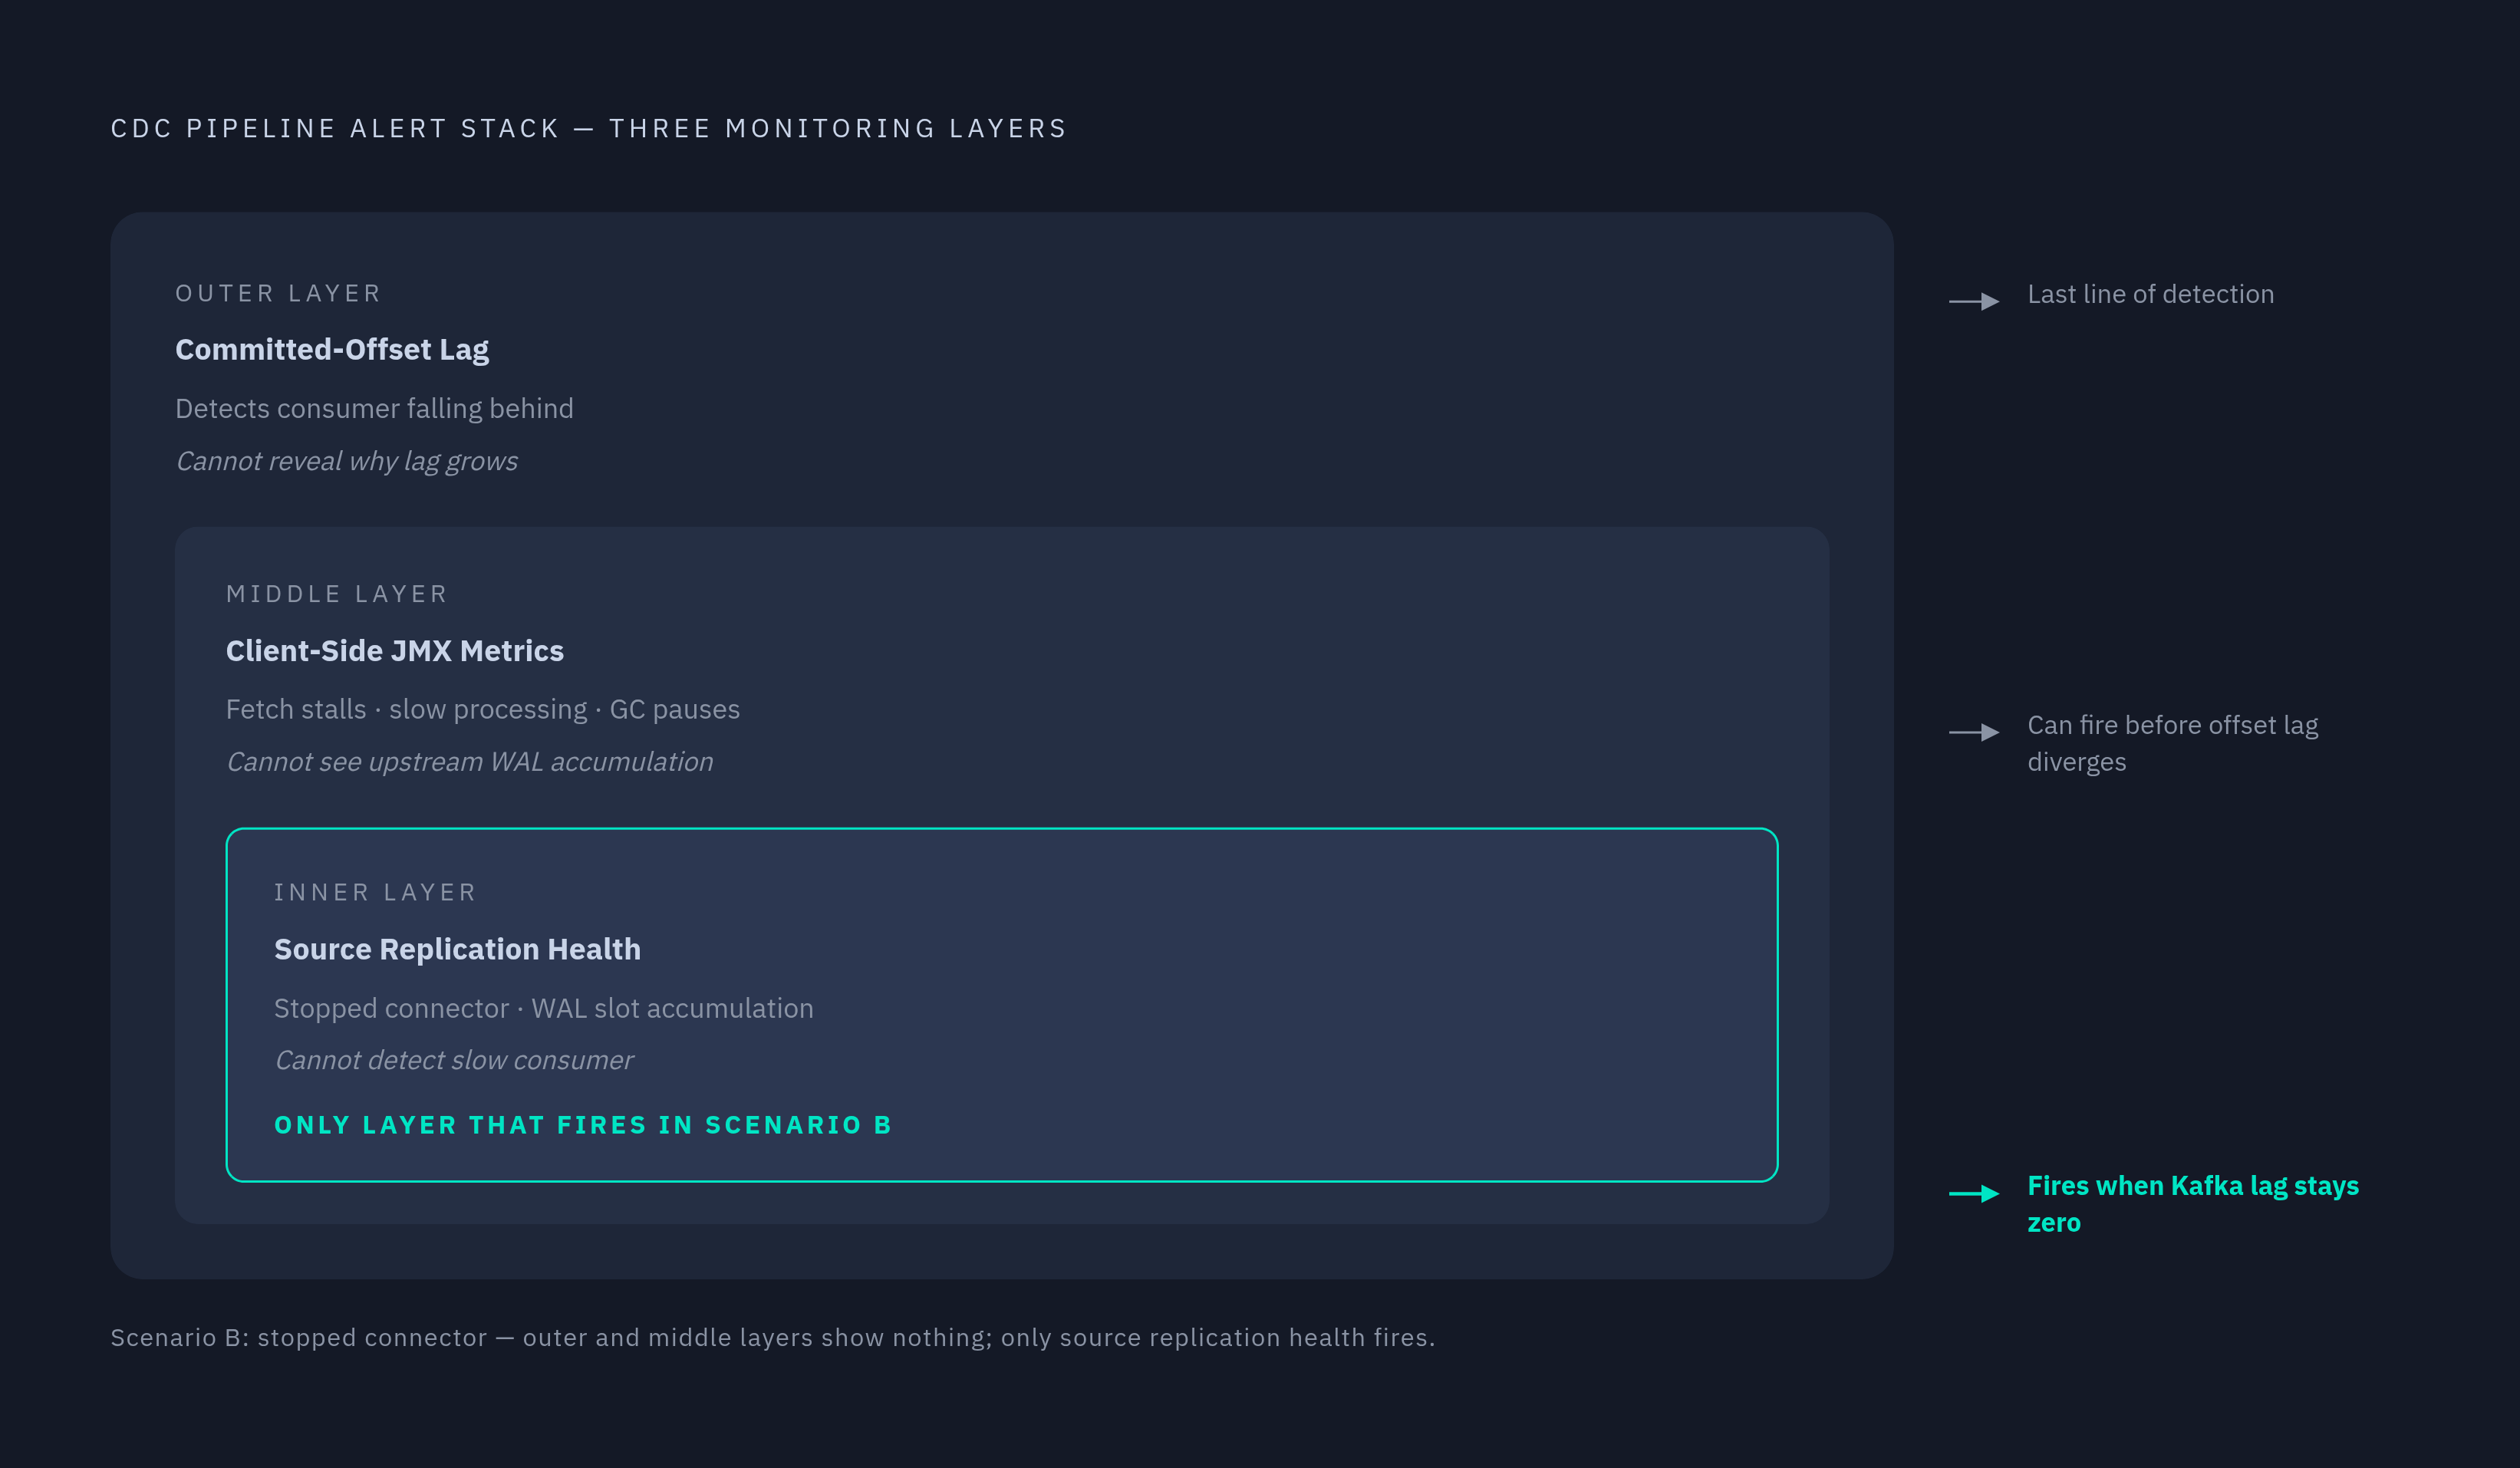
The outer ring is committed-offset lag, which detects the outcome of a consumer falling behind. It is the last line of detection. Inside that ring, client-side JMX fetch and processing metrics show problems such as slow processing, fetch stalls, and GC pauses. Those mechanisms can become visible before committed offsets diverge enough to trigger an alert.
The innermost ring is source replication health. It reveals an upstream precondition, such as retained WAL accumulating while a connector is stopped, that Kafka cannot observe directly. This nesting separates symptoms from their possible causes. Monitoring only committed offsets can delay a page until the destination is already far behind, while omitting source checks can leave PostgreSQL approaching disk exhaustion behind an apparently healthy Kafka dashboard.
Committed-offset lag: the baseline signal and how to alert on it without over-firing
Committed-offset lag is a partition’s log-end offset minus the consumer group’s last committed offset. It is the authoritative measure of the group’s committed position, but a raw threshold is an unreliable test for a stall. Some lag is expected because producers and consumers operate asynchronously. A fixed limit can therefore fire on a legitimate traffic spike as readily as on failed consumption.
Burrow, the open-source lag checker built at LinkedIn, evaluates committed offsets from __consumer_offsets over a sliding window. Its per-partition trend evaluation avoids hardcoded lag thresholds. Burrow exposes an HTTP endpoint for status queries and supports email or HTTP notifications. A practical Prometheus integration scrapes its REST API and alerts when an error state persists across a sustained window.
Partition detail is essential to interpreting that alert. Lag for the group as a whole can hide a single hot or stuck partition. When lag is spread evenly across partitions, it points to a problem across the group and calls for checking production rate first, but when lag is concentrated, it calls for checking partition-key skew and the CONSUMER-ID column to find the instance with the problem. Time lag gives the result operational meaning because “50,000 messages behind” is ambiguous, while “30 seconds behind” can be compared with a freshness SLO. Even then, committed offsets establish only that progress is behind.
Client-side JMX signals that reveal why lag is growing before it becomes critical
Kafka exposes hundreds of metrics through Java Management Extensions, and the standard observability stack pairs the Prometheus JMX Exporter with Grafana dashboards. Per-partition fetch metrics are available under kafka.consumer:type=consumer-fetch-manager-metrics,client-id=*,topic=*,partition=*. They add detail from the consumer side, but committed-offset monitoring is still needed.
Four metrics give that detail practical value. records-lag-max reports the maximum lag across a consumer’s assigned partitions and can expose short-term stalls before committed positions diverge. fetch-latency-avg measures the wait for Kafka fetch responses, while records-consumed-rate shows whether consumption is keeping pace with stable production. commit-latency-avg exposes slow offset commits, which can make committed-offset metrics understate actual consumer progress. These signals help tell whether the consumer is waiting, processing, or committing, so every backlog need not be treated as a lack of capacity.
CPU and processing time sharpen the diagnosis. When CPU is low, high fetch latency points to delays in the broker or network, while high processing time points to blocking database writes or HTTP calls. The fixes are to check broker and network health or make blocking calls asynchronous or batched. High CPU with low throughput calls for profiling serialization and deserialization, while CPU spikes followed by pauses point to GC pressure and heap tuning. If processing remains steady but production outpaces it, more consumer instances can help up to the partition count.
Rebalances create a separate interruption in consumption. Exceeding max.poll.interval.ms triggers reassignment, and pauses can last seconds to minutes in older protocol versions. Static membership prevents rebalance storms caused by transient restarts. Schema failures need a different safeguard because removing a field can crash consumers during deserialization, and JMX can only report that consumption has stopped after the crash. A two-phase migration adds the new column and moves consumers to it before dropping the old column, and Schema Registry compatibility rules must be enforced before deployment.
Upstream replication slot and WAL health: the signal layer outside Kafka entirely
PostgreSQL replication slots expose a failure Kafka cannot see. A logical replication slot retains WAL since its consumer’s last confirmed LSN, so a paused, crashed, or slow connector leaves WAL accumulating in pg_wal. That accumulation can threaten database disk availability. Meanwhile, Kafka consumer lag may stay flat because no new events are arriving to widen the offset gap.
In pg_replication_slots, active = false together with a large pg_wal_lsn_diff between confirmed_flush_lsn and the current WAL position identifies the dead-slot pattern. Monitoring replication lag through pg_stat_replication helps detect slow active connectors before they stop. These checks observe the source’s backlog.
Two safeguards limit the consequences of neglected slots. Setting max_slot_wal_keep_size provides a hard safety net by allowing a slot to be invalidated rather than letting retained WAL fill the disk, at the cost of a re-snapshot if the slot is lost. Dropping slots that are no longer needed removes orphaned WAL accumulators. Long transactions require a different interpretation because their CDC events become available only after commit, producing quiet execution followed by a burst.
MySQL exposes binlog retention and binlog position lag, while MongoDB requires attention to the oplog window and the risk of it wrapping past the change stream’s resume token. Neither maps directly onto Kafka offsets.
How the three layers interact during a real incident, and what each one catches first
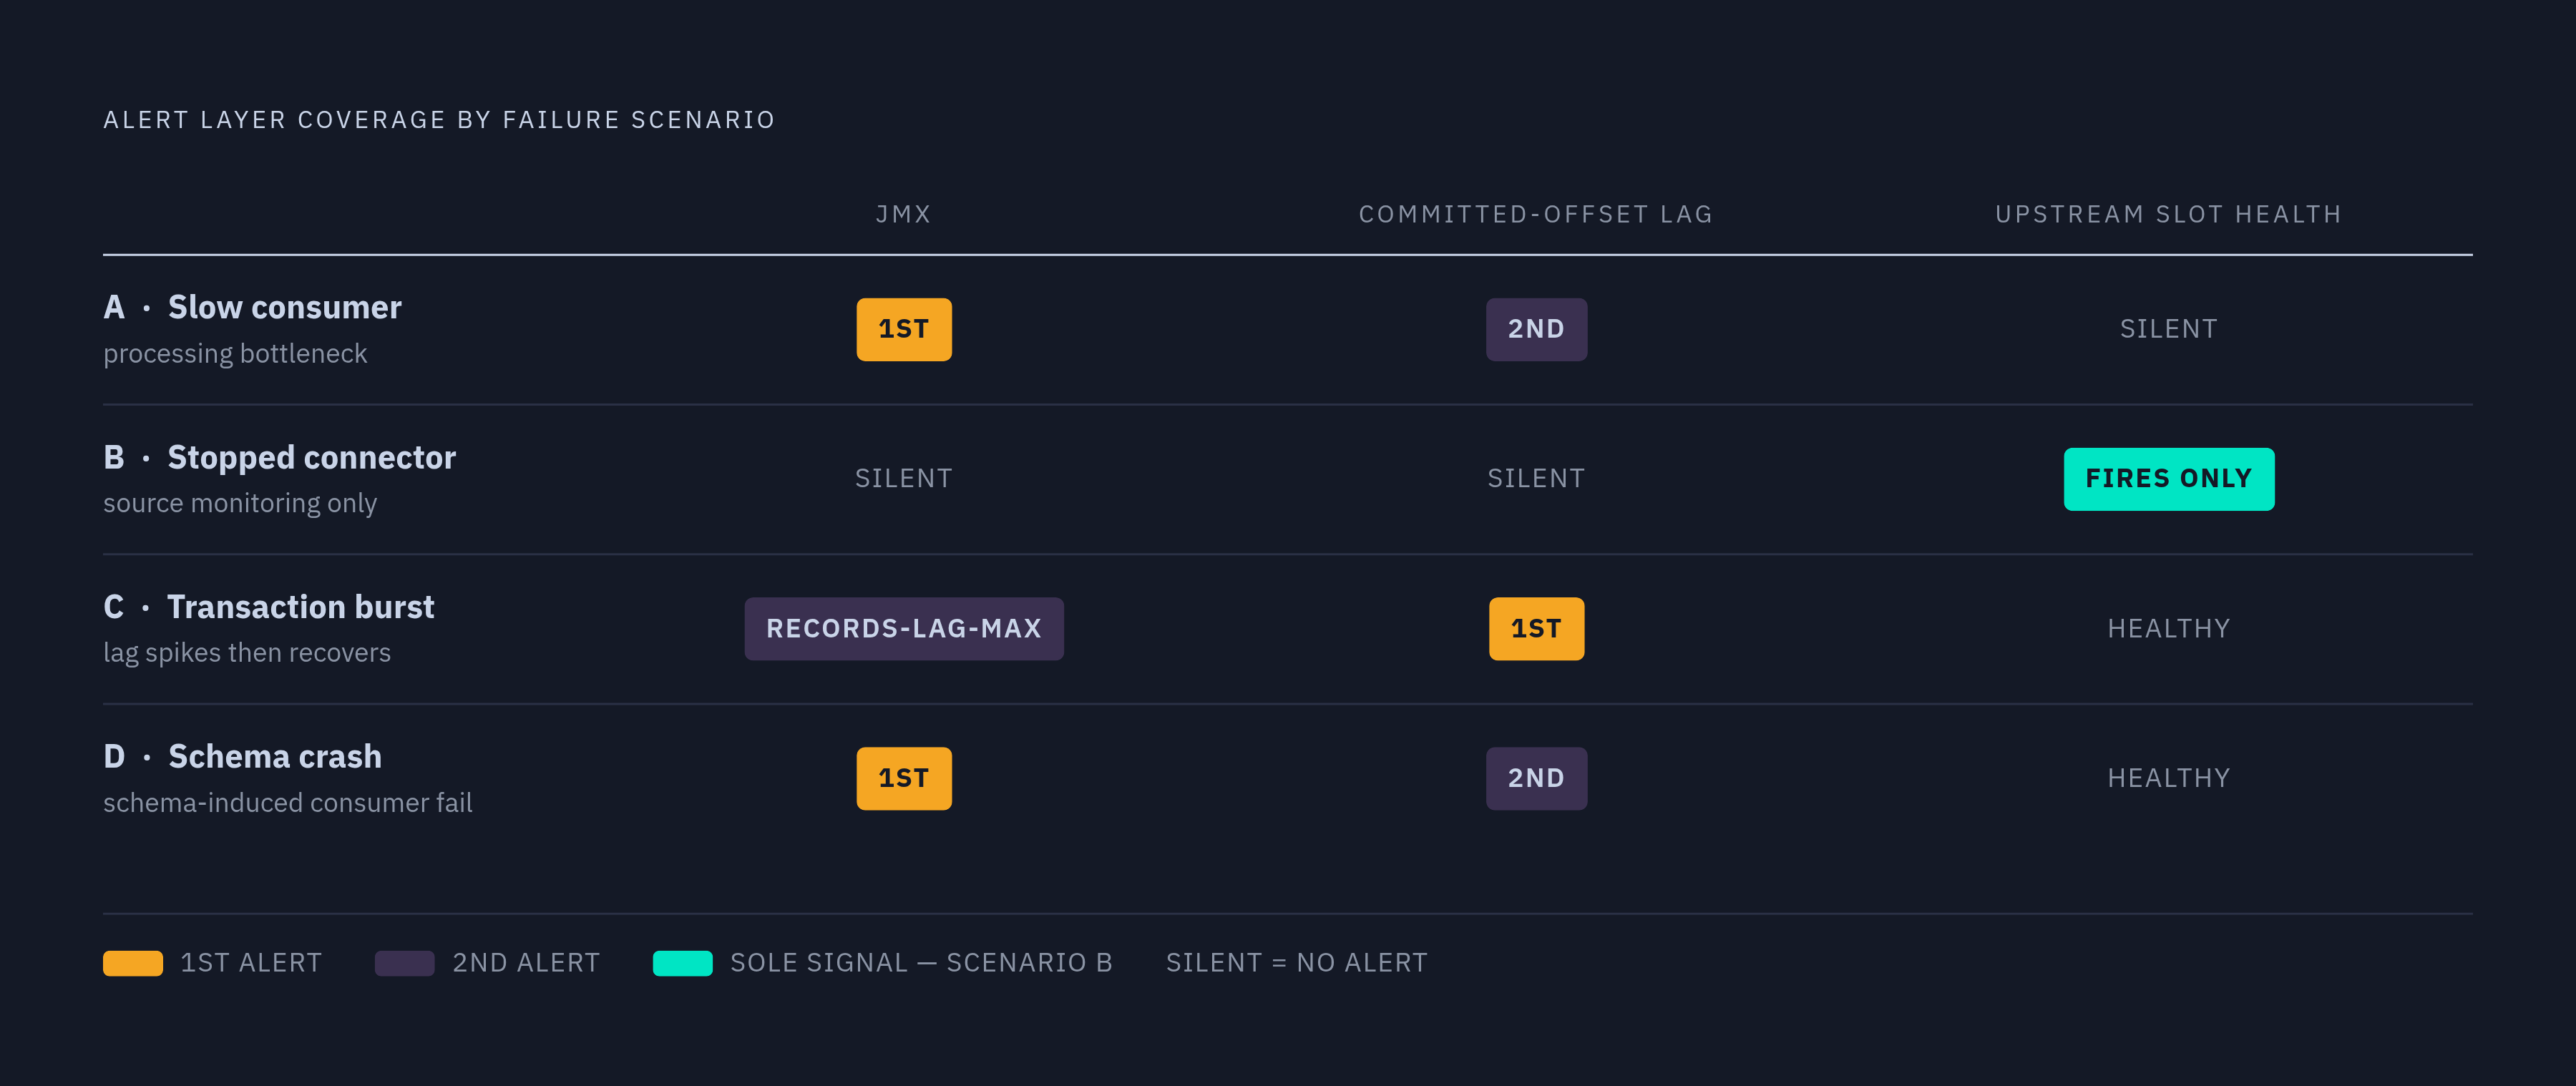
Scenario A. A slow consumer’s processing bottleneck lowers records-consumed-rate while fetch-latency-avg stays normal. Committed-offset lag grows gradually, but upstream slot health remains unaffected. JMX gives the first warning in this pattern. A committed-offset alert follows, while slot monitoring has no failure to report.
Scenario B. With a stopped connector, PostgreSQL shows active = false and rising WAL retention while Kafka lag remains flat or zero. JMX metrics are quiet because new events are not arriving. Source monitoring is the only layer that fires.
Scenario C. In a large transaction burst, the upstream slot remains active and healthy, then consumer lag spikes when the transaction commits. JMX shows high records-lag-max and elevated processing rate as consumption catches up. Committed-offset lag jumps and then recovers. That recovery distinguishes normal catch-up from a sustained stall.
Scenario D. With a schema-induced consumer crash, records-consumed-rate drops to zero, committed-offset lag climbs continuously, and the upstream slot remains healthy. JMX fires first, then the committed-offset alert fires. Identifying the cause requires correlating lag onset with recent schema deployments. For consumer-side triage, the sequence is to check group state and affected partitions, compare production rate, inspect processing through JMX, and then check rebalances.
Threshold calibration: setting alert levels that fire on genuine stalls without drowning in noise
Threshold calibration begins with the consuming application’s freshness SLO. Limits that are too tight create noise, while loose limits allow source-to-destination divergence to persist. Offset counts alone cannot resolve that tension. Translating lag into time connects the alert to the application’s latency budget, whether the consumer supports fraud detection, an AI agent, or an analytics dashboard.
The evaluation window must fit that same budget. Sustained directional growth is a stronger warning than a single threshold crossing because legitimate bursts may clear without intervention. The window gives those bursts time to recover, but also determines how long a genuine problem can grow before notification. Its duration should therefore follow the freshness requirement and traffic shape.
A STALL means committed offsets have not advanced within the evaluation window and calls for an immediate page. When offsets advance but lag grows, it points to a processing or capacity problem and allows a longer notification window in which to look into the cause. Upstream alerts need separate calibration, using retained WAL as a fraction of available disk and persistent slot inactivity after a short grace period for normal connector restarts.
Tooling options for each signal layer and the gaps each leaves uncovered
Burrow fits teams that need dedicated, trend-based committed-offset evaluation. It does not provide client processing metrics or source replication health. Kafka Lag Exporter offers a lighter path for exporting consumer-group lag to Prometheus without a full JMX Exporter setup for each consumer, and it pairs with Grafana community dashboards. It also leaves upstream database health outside its native coverage.
Managed and operational tools cover different parts of the problem. NetApp Instaclustr provides built-in dashboards and automated alerts across brokers, producers, consumers, KRaft, and Kafka Connect in a managed cluster context. It also monitors committed-offset lag and JMX at the broker level.
Kpow calculates lag directly from start and end offsets through AdminClient, allowing offsets to be read and reset even when every consumer instance is offline. This addresses the case where a poison message has taken down the entire group and standard tools lose visibility. It does not remove the need for source monitoring.
Dedicated exporters suit committed-offset visibility, managed dashboards extend cluster monitoring, and client-side JMX exposes processing mechanisms. None of these options supplies the upstream database checks described here. Those require direct instrumentation of PostgreSQL replication views or equivalent binlog and oplog signals, feeding the same Prometheus/Grafana stack or a database observability tool.
End-to-end freshness as the signal that the full pipeline cannot hide behind
Even complete source and Kafka instrumentation can miss a downstream freshness failure. A warehouse refreshing hourly, a materialized view rebuilt on a cron, or a feature store batching writes can delay query availability after consumption has succeeded. Consumer lag remains healthy throughout that delay. Sub-second Kafka lag does not establish that an AI agent, dashboard, or A/B testing framework can read current data.
The operational SLO must therefore span source commit to destination queryability. That measurement needs the database commit timestamp embedded in the CDC event payload and the time the destination row becomes queryable. The time between them is the delay the consuming application sees.
The actionable safeguard is a freshness heartbeat. A synthetic event written to the source database at a regular interval is tracked through the pipeline until it becomes queryable at the destination. Its end-to-end transit time is measured against the freshness SLO. If the heartbeat stops arriving or exceeds that budget, the alert fires regardless of what Kafka consumer lag reports.